The Reserve Bank of India (RBI) cut its policy rate by 25 basis points to 6.0 percent and has now cut it by 50 points since Governor Shakitanta Das took over from his predecessor Urjit Patel who resigned in December following pressure by Prime Minister Narendra Modi on the central bank to boost the economy ahead of general elections that kick off next week and conclude on May 23.
The rate cut was expected by investors in light of slowing growth and below-target inflation, and India's rupee only fell about 1 percent to 69.1 per U.S. dollar before bouncing back a bit.
Today's slight drop in the rupee comes after it has risen almost 8 percent since early October last year and compared with the start of 2019, the rupee is still up around 1.2 percent.
RBI's rate cut confirms the shift toward easier monetary policy worldwide since January, highlighted by the U.S. Federal Reserve and the European Central Bank's decisions to push back planned rate rises for this year to 2020 while they take stock of the extent of the global slowdown.
"The slowdown appears to be synchronized across advanced economies and some major emerging market economies as well," Das said, adding there has been a further loss of pace in global economic activity since the previous policy meeting in February which is reflected in decisions by central banks to pause or ease as inflation remains low.
India's economy began decelerating last year on slower public and private consumption, with total output slowing to growth of 6.6 percent in the fourth quarter of 2018 from 7 percent in the third quarter.
Since February, when RBI's monetary policy committee also cut its rate 25 basis points, signs of weakening investment activity have emerged, RBI said, adding slowing global growth might impact its exports, which remained weak in January and February.
On the other hand, private consumption is expected to improve from public spending in rural areas and higher income from tax benefits, while foreign direct investment inflows remained strong, helping boost foreign exchange reserves and narrow the current account deficit.
"The need is to strengthen domestic growth impulses by spurring private investment which has remained sluggish," RBI said, adding the output gap remains negative.
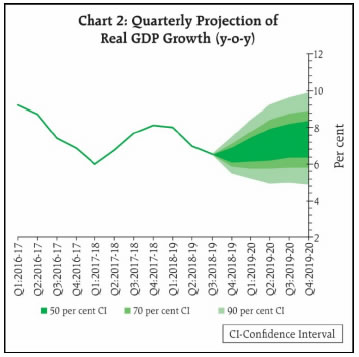
RBI lowered its outlook for economic growth in the current 2019/20 financial year, which began April 1, to 7.2 percent from February's forecast of 7.4 percent. Risks remain balanced.
After 4 months of decline, India's headline inflation rate rose to 2.6 percent in February but the central bank noted the increase was due to higher prices of goods that exclude food and fuel, such as personal care and recreation, and inflation expectations by households declined.
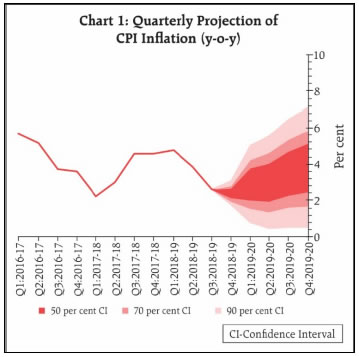
In February RBI forecast inflation of 2.8 percent in the fourth quarter of 2018/19 but today it lowered this to 2.4 percent.
For the first half of 2019/20 RBI forecast inflation of 2.9-3.0 percent, down from its previous forecast of 3.2-3.4 percent, and inflation of 3.9 percent in the third quarter of the current fiscal year, with risks broadly balanced.
RBI targets inflation of 4.0 percent.
Unlike February, when RBI's monetary policy committee was unanimous in its decision, 4 of its members, including the governor, voted for today's rate cut while 2 members to maintain the rate.
The Reserve Bank of India released the 1st bi-monthly policy statement for 2019-20:
"On the basis of an assessment of the current and evolving macroeconomic situation, the Monetary Policy Committee (MPC) at its meeting today decided to:
- reduce the policy repo rate under the liquidity adjustment facility (LAF) by 25 basis points to 6.0 per cent from 6.25 per cent with immediate effect.
Consequently, the reverse repo rate under the LAF stands adjusted to 5.75 per cent, and the marginal standing facility (MSF) rate and the Bank Rate to 6.25 per cent.
The MPC also decided to maintain the neutral monetary policy stance.
These decisions are in consonance with the objective of achieving the medium-term target for consumer price index (CPI) inflation of 4 per cent within a band of +/- 2 per cent, while supporting growth.
The main considerations underlying the decision are set out in the statement below.
Assessment
Global Economy
2. Since the last MPC meeting in February 2019, global economic activity has been losing pace. In the US, the subdued performance in the final quarter of 2018 appears to have continued into Q1:2019 as reflected in declining factory activity. The Euro area slowed down in Q4:2018 on soft domestic demand and contracting manufacturing activity. Of its constituents, the Italian economy contracted for two consecutive quarters in Q3 and Q4. In the UK, growth slowed down on Brexit uncertainty, with industrial production contracting during September-January. The Japanese economy rebounded in Q4 on increased domestic consumption expenditure and recovering investment spending. However, the latest data on manufacturing activity and business confidence suggest that growth lost momentum in Q1:2019. The monetary policy stances of the US Fed and central banks in other major advanced economies (AEs) have turned dovish.
3. Economic activity also slowed down in some major emerging market economies (EMEs). The Chinese economy decelerated in Q4:2018 on subdued domestic and global demand impacting industrial activity. Much of this weakness seems to have continued into 2019 as reflected in low factory output in Q1, though the purchasing managers’ index (PMI) moved into expansion zone in March after three months of contraction. In Q1, the Russian economy continued to be impacted by both domestic and external headwinds. The Brazilian economy ended 2018 on a weak note; going into 2019, available economic indicators for Q1 suggest that economic activity remained restrained by both weak domestic and external demand. The South African economy slowed down in the final quarter of 2018. Subdued industrial activity and worsening external demand point to a further loss in momentum in Q1.
4. Crude oil prices have risen on production cuts by OPEC and Russia as well as disruption in supplies due to US sanctions on exports from Venezuela. Gold prices weakened on expectations of positive outcomes of the China-US trade deal. Inflation continued to remain low in major AEs and many key EMEs due to slowing global growth and stable or falling commodity prices.
5. Financial markets continued to be driven by monetary policy stances of key central banks and movements in crude oil prices. In the US, the equity market witnessed some selling pressure in the last week of March on weak economic data. Equity markets in EMEs gained, benefitting from country-specific factors and easing of global financing conditions. Bond yields in the US softened, slipped into negative territory in Germany and dipped further into negative territory in Japan as central banks signalled softer stances. Bond yields in most EMEs have been falling in tandem with those in AEs and on the improving inflation outlook. In currency markets, the US dollar has traded with an appreciating bias in recent weeks. EME currencies have traded with a depreciating bias on country-specific factors and on fears of a weakening economic outlook in China.
Domestic Economy
6. Turning to the domestic economy, the second advance estimates for 2018-19 released by the Central Statistics Office (CSO) in February 2019 revised India’s real gross domestic product (GDP) growth downwards to 7.0 per cent from 7.2 per cent in the first advance estimates. Domestic economic activity decelerated for the third consecutive quarter in Q3:2018-19 due to a slowdown in consumption, both public and private. However, gross fixed capital formation (GFCF) growth remained in double digits for the fifth consecutive quarter in Q3, with the GFCF to GDP ratio rising to 33.1 per cent in Q3:2018-19 against 31.8 per cent in Q3:2017-18, supported primarily by the government’s thrust on the road sector and affordable housing. The drag on aggregate demand from net exports also moderated in Q3 due to a marginal acceleration in exports and a sharp deceleration in imports led by a decline in crude oil prices.
7. On the supply side, the second advance estimates of the CSO placed the growth of real gross value added (GVA) lower at 6.8 per cent in 2018-19 as compared with 6.9 per cent in 2017-18. GVA growth slowed down to 6.3 per cent in Q3 due to a deceleration in agriculture output from the record level achieved in the previous year. Industrial GVA growth remained unchanged in Q3, with manufacturing GVA growth slowing somewhat. Services GVA growth also remained unchanged in Q3; while growth in construction activity accelerated, there was some loss of momentum in public administration, defence and other services.
8. Beyond Q3, the second advance estimates of foodgrains production for 2018-19 at 281.4 million tonnes were 1.2 per cent lower than the fourth advance estimates of 2017-18, but 1.4 per cent higher than the second advance estimates of 2017-18. According to the National Oceanic and Atmospheric Administration (NOAA) of the US, El Niño conditions strengthened during February 2019, which may affect the prospects of a normal south west monsoon.
9. Of the high frequency indicators of industry, the manufacturing component of the index of industrial production (IIP) growth slowed down to 1.3 per cent in January 2019 due to automobiles, pharmaceuticals, and machinery and equipment. The growth of eight core industries remained sluggish in February. Credit flows to micro and small as well as medium industries remained tepid, though they improved for large industries. Capacity utilisation (CU) in the manufacturing sector, however, as measured by the Reserve Bank’s order books, inventory and capacity utilisation survey (OBICUS), improved to 75.9 per cent in Q3 from 74.8 per cent in Q2 exceeding its long-term average; the seasonally adjusted CU rose to 76.1 per cent from 75.4 per cent. The business assessment index of the industrial outlook survey (IOS) points to an improvement in overall sentiments in Q4. The manufacturing purchasing managers’ index (PMI) remained in expansion zone for 20th month in March. The key indicators of investment activity contracted, viz., production of capital goods in January and imports of capital goods in February.
10. High frequency indicators of the services sector suggest significant moderation in activity. Sales of commercial vehicles contracted during February. Other indicators of the transportation sector, viz., port freight traffic and international air freight traffic, also contracted. However, indicators of the construction sector, viz., consumption of steel and production of cement, continued to show healthy growth. The hotels sub-segment showed some improvement in foreign tourist arrivals in January and international air passenger traffic in February. The services PMI continued to be in expansion zone for the tenth consecutive month in March 2019.
11. Retail inflation, measured by y-o-y change in the CPI, rose to 2.6 per cent in February after four months of continuous decline. The uptick in inflation was driven by an increase in prices of items excluding food and fuel and weaker momentum of deflation in the food group. However, inflation in the fuel group collapsed to its lowest print in the new all India CPI series.
12. Within the food group, deflation in four sub-groups – vegetables, sugar, pulses and fruits – continued in February. Egg prices moved into inflation after remaining in deflation in previous three months, while inflation ticked up in all other food sub-groups.
13. Inflation in the fuel and light sub-group collapsed from 4.5 per cent in December to 1.2 per cent in February. Prices of liquefied petroleum gas (LPG) declined sharply, pulled down by the lagged impact of the softening of international energy prices. The prices of firewood, with the second largest weight in the fuel group, also declined. Electricity slipped into deflation in January and February. Inflation in kerosene remained elevated, however, reflecting the impact of the calibrated increase in its administered price.
14. CPI inflation excluding food and fuel declined to 5.2 per cent in January, but rose to 5.4 per cent in February, driven by a broad-based pick-up in inflation in the personal care and effects, and recreation and amusement sub-groups. However, inflation in the clothing and footwear, and transport and communication sub-groups fell, the latter reflecting the reduction in petrol and diesel prices. Inflation in the health and education sub-groups remained elevated, even though it moderated markedly during January-February vis-à-vis December.
15. Inflation expectations, measured by the Reserve Bank’s survey of households, declined in the February round over the previous round by 40 basis points each for the three months ahead and for the one year ahead horizons. Firms participating in the Reserve Bank’s industrial outlook survey of manufacturing companies reported reduction in input price pressures, but they expected an increase in staff expenses in Q1:2019-20. Farm and industrial input costs increased at a slow pace in January-February 2019. Nominal growth in rural wages and staff costs in the organised manufacturing and services sectors remained muted in Q3:2018-19.
16. From a daily net average surplus of ₹27,928 crore (₹279 billion) during February 1-6, 2019, systemic liquidity moved into deficit during February 7 - March 31, reflecting the build-up of government cash balances. Currency in circulation expanded sharply in February-March. The liquidity needs of the system were met through injection of durable liquidity amounting to ₹37,500 crore (₹375 billion) in February and ₹25,000 crore (₹250 billion) in March through open market purchase operations (OMOs). Consequently, total durable liquidity injected by the Reserve Bank through OMOs aggregated ₹2,98,500 crore (₹2,985 billion) for 2018-19. Liquidity injected under the LAF, on an average daily net basis, was ₹95,003 crore (₹950 billion) during February (February 7-28, 2019) and ₹57,043 crore (₹570 billion) in March. The weighted average call rate (WACR) remained broadly aligned with the policy repo rate in February and March.
17. Anticipating the seasonal tightening of liquidity at end-March, the Reserve Bank conducted four longer term (tenor ranging between 14-day and 56-day) variable rate repo auctions during the month in addition to the regular 14-day variable rate term repo auctions. Furthermore, the Reserve Bank conducted long-term foreign exchange buy/sell swaps of US$ 5 billion for a tenor of 3 years on March 26, 2019, thereby injecting durable liquidity of ₹34,561 crore (₹346 billion) into the system.
18. Export growth remained weak in January and February 2019 mainly due to exports of petroleum products decelerating in response to a fall in international crude oil prices. Among non-oil exports, engineering goods, chemicals, leather and marine products recorded either sequentially lower or negative growth. As in the case of exports, lower international crude oil prices downsized the oil import bill. Non-oil non-gold imports declined sharply, dragged down by the subdued demand for pearls and precious stones, transport equipment, project goods and vegetable oils. The trade deficit narrowed in February 2019 – both sequentially and on a year-on-year basis – to its lowest level in 17 months. This, along with the increase in services exports and lower outgo of income payments, resulted in narrowing of the current account deficit sequentially. On the financing side, net FDI inflows were strong in April-January 2018-19. Foreign portfolio investors turned net buyers in the domestic capital market in Q4:2018-19. India’s foreign exchange reserves were at US$ 412.9 billion on March 31, 2019.
Outlook
19. In the sixth bi-monthly monetary policy resolution of February 2019, CPI inflation was projected at 2.8 per cent for Q4:2018-19, 3.2-3.4 per cent for H1:2019-20 and 3.9 per cent for Q3:2019-20, with risks broadly balanced around the central trajectory. Actual inflation outcomes averaged 2.3 per cent in January-February.
20. The inflation path during 2019-20 is likely to be shaped by several factors. First, low food inflation during January-February will have a bearing on the near-term inflation outlook. Second, the fall in the fuel group inflation witnessed at the time of the February policy has become accentuated. Third, CPI inflation excluding food and fuel in February was lower than expected, which has imparted some downward bias to headline inflation. Fourth, international crude oil prices have increased by around 10 per cent since the last policy. Fifth, inflation expectations of households as well as input and output price expectations of producers polled in the Reserve Bank’s surveys have further moderated. Taking into consideration these factors and assuming a normal monsoon in 2019, the path of CPI inflation is revised downwards to 2.4 per cent in Q4:2018-19, 2.9-3.0 per cent in H1:2019-20 and 3.5-3.8 per cent in H2:2019-20, with risks broadly balanced.
21. GDP growth for 2019-20 in the February policy was projected at 7.4 per cent in the range of 7.2-7.4 per cent in H1, and 7.5 per cent in Q3 – with risks evenly balanced. Since then, there are some signs of domestic investment activity weakening as reflected in a slowdown in production and imports of capital goods. The moderation of growth in the global economy might impact India’s exports. On the positive side, however, higher financial flows to the commercial sector augur well for economic activity. Private consumption, which has remained resilient, is also expected to get a fillip from public spending in rural areas and an increase in disposable incomes of households due to tax benefits. Business expectations continue to be optimistic. Taking into consideration the above factors, GDP growth for 2019-20 is projected at 7.2 per cent – in the range of 6.8-7.1 per cent in H1:2019-20 and 7.3-7.4 per cent in H2 – with risks evenly balanced.
22. Beyond the near term, several uncertainties cloud the inflation outlook. First, with the domestic and global demand-supply balance of key food items expected to remain favourable, the short-term outlook for food inflation remains benign. However, early reports suggest some probability of El Niño effects in 2019. There is also the risk of an abrupt reversal in vegetable prices, especially during the summer months. Second, inflation in fuel group items, particularly electricity, firewood and chips saw unprecedented softening in H2:2018-19. There is, however, uncertainty about the sustainability of this softening in inflation in fuel items. Third, the outlook for oil prices continues to be hazy, both on the upside and the downside. On the one hand, continuing OPEC production cuts will reduce supplies. On the other hand, there is considerable uncertainty about demand conditions. Should there be a swift resolution of trade tensions, a pick-up in global demand is likely to push up oil prices. However, should trade tensions linger and demand conditions worsen, crude prices may fall from current levels, despite production cuts by OPEC. Fourth, inflation excluding food and fuel has remained elevated over the past twelve months with some pick up in prices in February. However, should the recent slowdown in domestic economic activity accentuate, it may have a bearing on the outlook for inflation in this category. Fifth, financial markets remain volatile reflecting in part global growth and trade uncertainty, which may have an influence on the inflation outlook. Sixth, the fiscal situation at the general government level requires careful monitoring.
23. The MPC notes that the output gap remains negative and the domestic economy is facing headwinds, especially on the global front. The need is to strengthen domestic growth impulses by spurring private investment which has remained sluggish.
24. Against this backdrop, the MPC decided to reduce the policy repo rate by 25 basis points and maintain the neutral stance of monetary policy.
25. Dr. Pami Dua, Dr. Ravindra H. Dholakia, Dr. Michael Debabrata Patra and Shri Shaktikanta Das voted in favour of the decision to reduce the policy repo rate by 25 basis points. Dr. Chetan Ghate and Dr. Viral V. Acharya voted to keep the policy rate unchanged.
26. Dr. Chetan Ghate, Dr. Pami Dua, Dr. Michael Debabrata Patra, Dr. Viral V. Acharya and Shri Shaktikanta Das voted in favour of the decision to maintain the neutral stance of monetary policy. Dr. Ravindra H. Dholakia voted to change the stance from neutral to accommodative.
27. The minutes of the MPC’s meeting will be published by April 18, 2019.
28. The next meeting of the MPC is scheduled during June 3, 4 and 6, 2019."
0 comments:
Post a Comment