The Reserve Bank of India (RBI), which has kept its rate steady since cutting it by 25 basis points in August 2017, voiced confidence about economic activity, which is rising due to a revival in investment activity as reflected in a sustained expansion of capital goods production and rising imports, along with improving global demand, which should encourage exports and investment.
Five members of the monetary policy committee voted in favor of keeping the rate steady while one member, Michael Debabrata Patra, once again wanted to raise the rate by 25 basis points. In February Patra also voted for a rate hike.
India's economy took a hit last year from the government's surprise decision in November 2016 to ban 500 and 1,000 rupee notes, around 86 percent of currency in circulation. The aim of the ban was to root out corruption and tax evasion but the result was that it dented consumer demand and turnover in sectors that relied on cash, such as retail, hotels, restaurants and transportation.
But a domestic "cyclical recovery" is now underway, reinforced by structural reforms, helping close the output gap, RBI said.
And while global growth and trade is strengthening, the RBI also cautioned that "rising trade protectionism and financial market volatility could derail the ongoing global recovery," which just reinforces the need to strengthen macroeconomic fundamentals along with continuing to deleverate distressed corporations and rebuild bank balance sheets.
India's Gross Domestic Product is forecast to expand 7.4 percent in the 2018-19 year, which began April 1, from 6.6 percent in 2017-18, with growth in the first half of this year of 7.3-7.4 percent and second half growth of 7.3-7.6 percent, with the risks evenly balanced.
In February the RBI had reiterated the finance ministry's forecast of 7.2 percent for 2018-19, with first half growth of 7.3-7.4 percent and second half growth of 7.1-7.2 percent.
India's inflation rate has been decelerating in the last two months due to a sharp decline in vegetable prices and lower fuel prices, and RBI expects vegetable prices to continue to ease in March, projecting fourth quarter 2017-18 inflation of 4.5 percent, just up from February's 4.44 percent, but down from 5.1 percent previously forecast.
For the current 2018-19 year, RBI forecast inflation of 4.7-5.1 percent in the first half and 4.4 percent in the second half, including the impact of housing rent allowances, with risks to the upside.
In February RBI had projected first half 2018-19 inflation of 5.1-5.6 percent and 4.5-4.6 percent in the second half.
RBI targets inflation of 4.0 percent, plus/minus 2 percentage points.
After depreciating steadily from May 2014 through 2016, India's rupee strengthened last year but has given back some of its gains since the start of this year.
Today the rupee was trading at 64.87 to the U.S. dollar, down 1.6 percent since the start of 2018.
The Reserve Bank of India issued the the first bi-monthly monetary policy statement for the 2018-19 year:
"On the basis of an assessment of the current and evolving macroeconomic situation1 at its meeting today, the Monetary Policy Committee (MPC) decided to:
- keep the policy repo rate under the liquidity adjustment facility (LAF) unchanged at 6.0 per cent.
Consequently, the reverse repo rate under the LAF remains at 5.75 per cent, and the marginal standing facility (MSF) rate and the Bank Rate at 6.25 per cent.
The decision of the MPC is consistent with the neutral stance of monetary policy in consonance with the objective of achieving the medium-term target for consumer price index (CPI) inflation of 4 per cent within a band of +/- 2 per cent, while supporting growth. The main considerations underlying the decision are set out in the statement below.
Assessment
2. Since the MPC’s last meeting in February 2018, global economic activity has gathered further momentum, both in advanced and emerging market economies, though financial market volatility and potential trade wars pose a threat to the outlook. Among advanced economies (AEs), the US economy, which ended 2017 on a slightly weak note, appeared to have bounced back in Q1:2018; the unemployment rate remains low with hiring around multi-month highs. In the Euro Area, economic activity remained buoyant, although consumer spending and factory activity slowed down due to the strengthening of the euro, but a consistently falling unemployment rate and elevated consumer confidence continued to underpin the strength of the economy. The Japanese economy registered eight straight quarters of growth till Q4:2017; available data for 2018 point to a slower start to the year with weak machinery orders and an easing manufacturing Purchasing Manager’s Index (PMI) in February-March.
3. Economic activity remained robust in emerging market economies (EMEs) in Q1:2018. The Chinese economy started the year on a strong note; retail sales picked up pace indicating robust consumption, while industrial production also registered a strong increase in Q1:2018 on improved mining and manufacturing activity. In Brazil, economic activity is gaining momentum, driven by higher commodity prices. The Russian economy continued to recover in Q1; industrial production expanded in January-February, after two months of contraction, while exports grew at a robust pace. In South Africa, leading indicators, viz., the manufacturing PMI and business confidence, improved in Q1.
4. World trade volume growth is expected to have been robust in Q1, as gauged from the data on container trade throughput, air freight and export orders. Crude oil prices have become volatile in the recent period. After softening in February from multi-year highs on increased production in the US, crude prices hardened in the second half of March, driven by rebalancing of supply by OPEC and Russia, and drawdown of US inventories. Metal prices have come under selling pressure, with copper touching a three-month low in March on uncertainty stemming from global trade protectionism and US monetary policy. Gold prices, which touched a two-month low in March, have recently witnessed some uptick on fears of intensification of a trade war. Inflation remains below target in many key AEs and EMEs.
5. Financial markets turned volatile in February-March, triggered by uncertainty regarding the pace of normalisation of US monetary policy, and concerns surrounding global trade. Equity markets globally have shed most of the gains of the previous quarter in a heavy sell off in February-March, caused by optimistic US job reports and the US imposition of new tariffs on Chinese goods. Yields in the US traded sideways on weaker than expected inflation pressures and the anticipated rate hike by the Fed. Yields in other major AEs have fallen, while among EMEs, they have remained divergent on country-specific factors. In currency markets, the US dollar, which recovered somewhat in early March on an optimistic outlook of the economy, shed most of its gains in the latter part of the month on a less hawkish stance of the Fed and on anxieties surrounding a possible trade war. Among other major currencies, the euro continued to appreciate on an improving growth outlook for the region. Most EME currencies have retreated in the wake of the recent market volatility and the improving US economic outlook, though investors continued to discriminate on country-specific factors.
6. Turning to the domestic economy, the Central Statistics Office (CSO) released its second advance estimates for 2017-18 on February 28, revising India’s real gross domestic product (GDP) growth marginally upward to 6.6 per cent from 6.5 per cent in the first advance estimates released on January 5. GDP growth in 2017-18 at 6.6 per cent was lower than 7.1 per cent in 2016-17 and the deceleration was broad-based, but each component revealed intra-year turning points. Private consumption growth – whose contribution to GDP growth in 2017-18 was 68 per cent – moderated in the second half. Goods and services tax (GST) implementation had an adverse, even if transient, effect on urban consumption through loss of output and employment in the labour-intensive unorganised sector. Government expenditure provided sustained support to aggregate demand, with a pick-up in pace in the second half. Gross fixed capital formation turned around in Q2 and accelerated in the second half – markedly so in Q3 – reflecting the first signs of a sustained expansion in capital goods production and a modest revival of construction activity. Net exports dragged down aggregate demand in 2017-18 due to a surge in imports and deceleration in exports in Q3, the latter being driven in part by GST-related working capital disruptions.
7. For Q4, high frequency indicators point to a further strengthening of demand conditions. Private consumption seems to be improving on the back of strong growth in domestic air passenger traffic and foreign tourist arrivals, rising sales growth of passenger vehicles and a strong upturn in the production of consumer durables. The growth in sales of two-wheelers and tractors reflects buoyant rural consumption. Capital goods production registered a 19-month high growth in January 2018, indicative of the likely traction in investment demand. Housing loans extended by banks have increased significantly, which is a positive for residential investment. External demand remains a weak link. Merchandise import growth has slowed because of gold imports; simultaneously export growth has also weakened.
8. Turning to the supply side at a disaggregated sectoral level, the kharif foodgrains production for 2017-18 has been revised upward by 2.8 per cent in the second advance estimates released in February 2018 as compared with the first advance estimates released in September 2017. Total foodgrains production for 2017-18 is estimated at 277.5 million tonnes, up by 0.9 per cent from the level of 2016-17, with the production of rice, pulses and coarse cereals estimated to reach a record high. Wheat production is estimated to be lower than last year due to a decline in acreage and low soil moisture, but imports of 1.6 million tonnes and comfortable buffer stocks should cushion potential adverse effects. Horticulture production touched a new peak of 305.4 million tonnes in 2017-18, up by 1.6 per cent from last year.
9. For the year 2017-18 as a whole, the CSO estimates that value added in industry decelerated in relation to the previous year; in terms of quarterly performance, however, expansion set in by Q2 and was built upon in Q3 and Q4. This was mainly driven by the rebound in manufacturing. The manufacturing PMI remained in an expansionary mode for the eighth consecutive month in March, although there was some moderation in Q4. Assessment of overall business sentiment for manufacturing also improved in Q4 as reflected in the Reserve Bank’s Industrial Outlook Survey, driven by increasing output and new orders. Growth of value added in the services sector accelerated through the year, driven by trade, hotels, transport and communication and a significant pick-up in construction activity. Other high frequency indicators of services sector activity such as domestic air passenger traffic, international freight traffic, port traffic and commercial vehicles sales also expanded at a fair pace. The services PMI moved out of contraction and stabilised in March on a renewed increase in new business and strengthening expectations.
10. Retail inflation, measured by the year-on-year change in the CPI, fell from a high of 5.1 per cent in January to 4.4 per cent in February due to a decline in inflation in food and fuel. Excluding the estimated impact of an increase in the house rent allowances (HRA) for central government employees under the 7th central pay commission (CPC), the headline inflation for February was at 4.1 per cent. Food inflation declined by 120 bps in February, pulled down by a sharp decline in vegetable prices, especially of onions and tomatoes, along with continuing deflation in pulses. The fall in prices was also observed in other food components such as eggs, sugar, meat and fish, oils, spices, cereals and milk.
11. In the fuel and light group, inflation in respect of liquefied petroleum gas declined in line with international price movements. Furthermore, the rate of increase in prices of firewood and chips, and dung cake moderated.
12. CPI inflation excluding food and fuel remained unchanged at 5.2 per cent for the third consecutive month in February, after rising from its trough in June 2017. Among its constituents, housing group inflation rose significantly, reflecting the HRA increase for central government employees. Excluding the HRA impact, inflation in this group was estimated markedly lower at 4.4 per cent. Inflation in the transport and communication group increased in February on account of the rise in petroleum product prices and transportation fares. Inflation either eased or remained at a low level in February in other major sub-groups such as household goods and services, recreation and amusement, education, and personal care and effects.
13. Households’ inflation expectations, measured by the March 2018 round of the Reserve Bank’s survey of households, edged up for both three-month and one-year ahead horizons. Manufacturing firms covered in the Reserve Bank’s Industrial Outlook Survey reported input price pressures and an increase in selling prices in Q4:2017-18, which are expected to continue in Q1:2018-19. Manufacturing and services firms polled by PMI also showed a rise in input and output prices in Q4.
14. Liquidity in the system moved between surplus and deficit during February-March 2018. From a daily net average surplus of ₹ 272 billion during February 1-11, 2018, liquidity moved into deficit during February 12-March 1, reflecting a slowdown in government spending and large tax collections. After turning into surplus during March 2-15, the system moved into deficit again during March 16-22 mainly on account of quarterly advance tax outflows. Anticipating the seasonal tightening of liquidity at the end of March, the Reserve Bank conducted four additional longer tenor (24-31 days) variable rate repo operations aggregating ₹ 1 trillion, apart from the regular repo operations. In mid-March, additional liquidity of ₹ 1 trillion got released into the system through redemption of Treasury Bills issued under the Market Stabilisation Scheme (MSS) in April and May 2017. On the whole, the Reserve Bank injected ₹ 60 billion and ₹ 213 billion on a net daily average basis in February and March, respectively. The weighted average call rate (WACR) inched closer to the policy repo rate from 12 basis points below the policy rate in January to 7 bps in February, and 5 bps in March.
15. Merchandise export growth decelerated in January and February 2018, pulled down by a slowdown in exports of gems and jewellery, readymade garments and engineering goods. Import growth also moderated in February due to a decline in gold imports, lower growth in non-oil non-gold imports, and contraction in imports of transport equipment, vegetable oils and pulses. As import growth continued to exceed export growth in January-February, the trade deficit widened. The current account deficit increased in Q3:2017-18, primarily on account of the higher trade deficit. Net foreign direct investment moderated in April-January 2017-18 vis-à-vis the level a year ago. Foreign portfolio investors made net purchases in 2017-18, despite net sales in the wake of a global sell-off in February. India’s foreign exchange reserves were at US$ 424.4 billion on March 30, 2018.
Outlook
16. The 6th bi-monthly resolution of 2017-18 in February projected CPI inflation at 5.1 per cent in Q4:2017-18; and in the range of 5.1-5.6 per cent in H1:2018-19 and 4.5-4.6 per cent in H2, including the HRA impact, with risks tilted to the upside. Actual inflation outcomes in January-February averaged 4.8 per cent, largely reflecting the sharp decline in vegetable prices and significant moderation in fuel group inflation. The available information suggests that vegetable prices continued to moderate in March as well. Accordingly, inflation in Q4:2017-18 is now projected at 4.5 per cent.
17. Several factors are likely to influence the inflation outlook. First, with the sharp moderation in food prices in February-March, the inflation trajectory in H1:2018-19 is expected to be lower than the projection in the February statement, despite a likely reversal in food prices in H1. Overall food inflation should remain under check on the assumption of a normal monsoon and effective supply management by the Government. Second, international crude oil prices have become volatile in the recent period, with a distinct hardening bias in the second half of March, even as the increase in shale production was more than expected. This has adversely impacted the outlook for crude oil prices. Third, on current assessment, Indian domestic demand is expected to strengthen during the course of the year. Fourth, the statistical impact of an increase in HRA for central government employees under the 7th CPC will continue till mid-2018, and gradually dissipate thereafter.
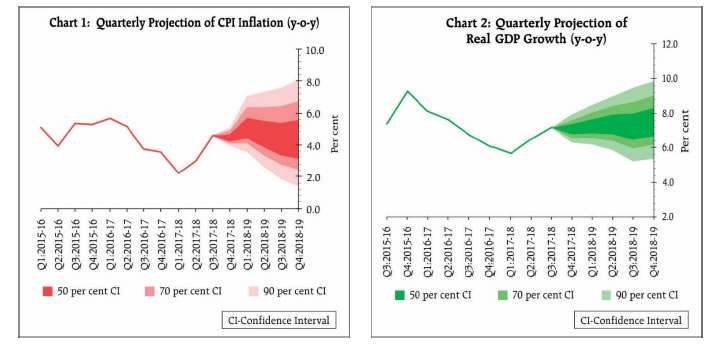
18. Taking these factors into consideration, projected CPI inflation for 2018-19 is revised to 4.7-5.1 per cent in H1:2018-19 and 4.4 per cent in H2, including the HRA impact for central government employees, with risks tilted to the upside (Chart 1). Excluding the impact of HRA revisions, CPI inflation is projected at 4.4-4.7 per cent in H1:2018-19 and 4.4 per cent in H2.
19. Turning to the growth outlook, several factors are expected to accelerate the pace of economic activity in 2018-19. First, there are now clearer signs of revival in investment activity as reflected in the sustained expansion in capital goods production and still rising imports, albeit at a slower pace than in January. Second, global demand has been improving, which should encourage exports and boost fresh investment. On the whole, GDP growth is projected to strengthen from 6.6 per cent in 2017-18 to 7.4 per cent in 2018-19 – in the range of 7.3-7.4 per cent in H1 and 7.3-7.6 per cent in H2 – with risks evenly balanced (Chart 2).2
20. The MPC notes that there are several uncertainties surrounding the baseline inflation path. First, the revised formula for MSP as announced in the Union Budget 2018-19 for kharif crops may have an impact on inflation, although the exact magnitude will be known only in the coming months. Second, the staggered impact of HRA revisions by various state governments may push headline inflation up. While the statistical impact of the HRA revisions will be looked through, there is a need to watch out for any second round effects. Third, in case there is any further fiscal slippage from the Union Budget estimates for 2018-19 or the medium-term path, it could adversely impact the outlook on inflation. There are also risks to inflation from fiscal slippages at the level of states on account of higher committed revenue expenditure. Fourth, should the monsoon turn deficient temporally and/or spatially, it may have a significant bearing on food inflation. Fifth, firms polled in the Reserve Bank’s Industrial Outlook Survey expect input and output prices to rise, going forward. Sixth, recent volatility in crude prices has imparted considerable uncertainty to the near-term outlook.
21. Against the above backdrop, the MPC decided to keep the policy repo rate on hold and continue with the neutral stance. The MPC reiterates its commitment to achieving the medium-term target for headline inflation of 4 per cent on a durable basis.
22. The MPC notes that growth has been recovering and the output gap is closing. This is also reflected in a pick-up in credit offtake in recent months. The large mobilisation of resources from the primary capital market should support investment activity further. While the domestic cyclical recovery is underway, the long-term growth potential is also expected to be reinforced by various structural reforms introduced in the recent past. On the downside, the deterioration in public finances risks crowding out private financing and investment. Furthermore, even as global growth and trade have been strengthening, rising trade protectionism and financial market volatility could derail the ongoing global recovery. In this unsettling global environment, it is especially important that domestic macroeconomic fundamentals are strengthened, deleveraging of distressed corporates and rebuilding of bank balance sheets persisted with, and the risk-sharing markets deepened.
23. Dr. Chetan Ghate, Dr. Pami Dua, Dr. Ravindra H. Dholakia, Dr. Viral V. Acharya and Dr. Urjit R. Patel voted in favour of the monetary policy decision. Dr. Michael Debabrata Patra voted for an increase in the policy rate of 25 basis points. The minutes of the MPC’s meeting will be published by April 19, 2018.
24. The next meeting of the MPC is scheduled on June 5 and 6, 2018.
0 comments:
Post a Comment