The Reserve Bank of India (RBI) has now raised its key rate twice this year and by a total of 50 basis points as inflation remains above its 4.0 percent midpoint target on higher oil prices and the fall in the rupee's exchange rate fuels inflation expectations.
But looking ahead, the RBI said risks to inflation were now balanced - in contrast to its policy report in June when the risks were tilted to the upside - as inflation had been slightly below its previous forecast as the seasonal surge in food prices had been muted and fruit prices had fallen.
In June India's inflation rate rose for the third consecutive month to 5.0 percent due to higher fuel prices despite muted food prices. Inflation expectations by households for both 3 months and 1-year ahead rose by another 20 basis points and manufacturing firms also reported higher input costs.
The RBI raised its forecasts for inflation in the second half of the current 2018-19 financial year slightly to 4.8 percent from June's forecast of 4.7 percent, including the impact of housing rent allowances for central government employees.
For the first quarter of the 2019-2020 financial year, which begins April 1, the RBI forecast inflation of 5.0 percent.
Unlike the unanimous policy decision in June, the RBI's monetary policy committee was split in its decision today, with five of its members, including the governor, voting for the hike and Ravindra Dholakia voting against.
The RBI's policy stance continues to be neutral as it balances the objective of reaching its inflation target of 4.0 percent, plus/minus 2 percentage points, while supporting economic growth.
Economic activity has accelerated in the last 3 quarters on strong exports and RBI retained its forecast for growth in the current 2018-19 financial year of 7.4 percent, with risks evenly balanced. In the first quarter of 2019-20, growth was projected at 7.5 percent.
In the first calendar quarter India's Gross Domestic Product grew by an annual rate of 7.7 percent, up from 7.0 percent in the previous quarter.
But the RBI is concerned over the risks to global growth from rising trade tensions and the uncertainty surrounding oil prices and thus inflation.
"Rising trade protectionism poses a grave risk to near-term and long-term global growth prospects by adversely impacting investment, disrupting global supply chains and hampering productivity," the RBI said.
Like most emerging market currencies, India's rupee has declined this year against the U.S. dollar though it rose after today's rate hike.
The rupee was trading at 68.4 to the dollar today, down 6.7 percent this year.
"On the basis of an assessment of the current and evolving macroeconomic situation at its meeting today, the Monetary Policy Committee (MPC) decided to:
- increase the policy repo rate under the liquidity adjustment facility (LAF) by 25 basis points to 6.5 per cent.
Consequently, the reverse repo rate under the LAF stands adjusted to 6.25 per cent, and the marginal standing facility (MSF) rate and the Bank Rate to 6.75 per cent.
The decision of the MPC is consistent with the neutral stance of monetary policy in consonance with the objective of achieving the medium-term target for consumer price index (CPI) inflation of 4 per cent within a band of +/- 2 per cent, while supporting growth. The main considerations underlying the decision are set out in the statement below.
Assessment
2. Since the last meeting of the MPC in June 2018, global economic activity has continued to maintain steam; however, global growth has become uneven and risks to the outlook have increased with rising trade tensions. Among advanced economies (AEs), the US economy rebounded strongly in Q2, after modest growth in Q1, on the back of rising personal consumption expenditures and exports. In the Euro Area, weak growth in Q1 continued in Q2 due to subdued consumer demand, weighed down by political uncertainty and a strong currency. In Japan, recent data on retail sales, consumer confidence and business sentiment point to moderation in growth.
3. Economic activity in major emerging market economies (EMEs) has slowed somewhat on volatile and elevated oil prices, mounting trade tensions and tightening of financial conditions. The Chinese economy lost some pace in Q2, pulled down by efforts to contain debt. The Russian economy picked up in Q1; recent data on employment, industrial production and exports indicate that the economy has gained further momentum. South Africa’s economy contracted in Q1; though consumer sentiment has improved, high unemployment and weak exports pose challenges. In Brazil, economic activity suffered a setback in Q1 on nation-wide strikes; more recent data suggest that growth remained muted as industrial production contracted in May and the manufacturing purchasing managers’ index (PMI) declined.
4. Global trade lost some traction due to intensification of trade wars and uncertainty stemming from Brexit negotiations. Crude oil prices, which remained volatile and elevated in May-June on a delicate demand-supply balance, eased modestly in the second half of July on higher supply from Organisation of Petroleum Exporting Countries (OPEC) and non-OPEC producers. Base metal prices have fallen on the general risk-off sentiment triggered by fears of an intensification of trade wars. Gold prices have softened on a stronger dollar. Inflation remained firm in the US, reflecting higher oil prices and stronger aggregate demand. Inflation has edged up also in some other major advanced and emerging economies, driven, in part, by rising energy prices and pass-through effects from currency depreciations.
5. Financial markets have continued to be driven mainly by monetary policy stances in major AEs and geopolitical tensions. Equity markets in AEs have declined on trade tensions and uncertainty relating to Brexit negotiations. Investors’ appetite for EME assets has waned on increases in interest rates by the US Fed. The 10-year sovereign yield in the US has moderated somewhat from its peak on May 17 on safe-haven demand, spurred by escalating trade conflicts. Yields have softened in other key AEs as well. In most EMEs, however, movements in yields have varied reflecting domestic macroeconomic fundamentals and tightening global liquidity. Capital flows to EMEs declined in anticipation of monetary policy tightening in AEs. In currency markets, the US dollar appreciated, supported by strong economic data. The euro strengthened in June on receding political uncertainty and taper talk by the central bank. However, the currency has traded soft thereafter on mixed economic data and the rising US dollar. EME currencies, in general, have depreciated against the US dollar over the last month.
6. On the domestic front, south-west monsoon has been recovering after a brief spell of deficiency in the second half of June. The cumulative rainfall up to July 31, 2018 was 6 per cent below the long-period average. In terms of spatial distribution, 28 of the 36 sub-divisions received normal or excess rainfall, whereas 8 sub-divisions received deficient rainfall as against three sub-divisions last year. The total sown area of kharif crops as on July 27 was 7.5 per cent lower than that a year ago. The live storage in major reservoirs as on July 26 was at 41 per cent of the full reservoir level compared with 36 per cent a year ago, which portends well for the rabi sowing season.
7. Industrial growth, measured by the index of industrial production (IIP), strengthened in April-May 2018 on a y-o-y basis. This was driven mainly by a significant turnaround in the production of capital goods and consumer durables. Growth in the infrastructure/construction sector accelerated sharply, reflecting the government’s thrust on national highways and rural housing, while the growth of consumer non-durables decelerated significantly. The output of eight core industries accelerated in June due to higher production in petroleum refinery products, steel, coal and cement. Capacity utilisation in the manufacturing sector remains robust. The assessment based on the Reserve Bank’s business expectations index (BEI) for Q1:2018-19 remained optimistic notwithstanding some softening in production, order books and exports. The July manufacturing PMI remained in expansion zone, although it eased from its level a month ago with slower growth in output, new orders and employment.
8. Several high-frequency indicators of services activity increased at a faster pace in May-June. Tractor and two-wheeler sales growth accelerated significantly, suggesting strong rural demand. Passenger vehicle sales growth, an indicator of urban demand, also strengthened. Commercial vehicle sales growth remained robust despite some deceleration. Domestic air passenger traffic – another indicator of urban demand – maintained double-digit growth. Construction activity indicators also improved with cement production sustaining double digit growth for the eighth consecutive month in June. Steel consumption also accelerated in May. The services PMI expanded to a twelve-month high in June, after a marginal contraction in May, supported by expansion in new business and employment.
9. Retail inflation, measured by the year-on-year change in the CPI, rose from 4.9 per cent in May to 5 per cent in June, driven by an uptick in inflation in fuel and in items other than food and fuel even as food inflation remained muted due to lower than usual seasonal uptick in prices of fruits and vegetables in summer months. Adjusting for the estimated impact of the 7th central pay commission’s house rent allowances (HRA), headline inflation increased from 4.5 per cent in May to 4.6 per cent in June. Low inflation continued in cereals, meat, milk, oil, spices and non-alcoholic beverages, and pulses and sugar prices remained in deflation.
10. Fuel and light group inflation rose sharply, pulled up by liquefied petroleum gas and kerosene. Inflation in firewood and chips ticked up, while electricity inflation remained low. The pass-through of global crude oil prices impacted inflation in domestic petroleum products as well as transport services. Inflation also picked up modestly in respect of education and health.
11. The June round of the Reserve Bank’s survey of households reported a further uptick of 20 basis points in inflation expectations for both three-month and one-year ahead horizons as compared with the last round. Manufacturing firms polled in the Reserve Bank’s industrial outlook survey (IOS) reported higher input costs and selling prices in Q1:2018-19. The manufacturing PMI showed that input prices eased slightly in July, although they remained high. Input costs for companies polled in Services PMI in June also stayed elevated. Farm and non-farm input costs rose significantly. Notwithstanding some pick-up in February and March 2018, rural wage growth remained moderate, while wage growth in the organised sector remained firm.
12. Systemic liquidity remained generally in surplus mode during June-July 2018. In June, the Reserve Bank absorbed surplus liquidity of around ₹ 140 billion on a daily net average basis under the LAF even as the system migrated from net surplus to a net deficit mode in the second half of the month due to advance tax outflows. Interest rates in the overnight call money market firmed up in June reflecting the increase in the repo rate on June 6, 2018. The weighted average call rate (WACR) traded, on an average, 12 basis points below the repo rate – the same as in May. Systemic liquidity moved back into surplus mode in early July with increased government spending but turned into deficit from July 10 onwards; on a daily net average basis, the Reserve Bank injected liquidity under the LAF of ₹ 107 billion in July. The WACR in July, on an average, traded 9 basis points below the policy rate. Based on an assessment of prevailing liquidity conditions and of durable liquidity needs going forward, the Reserve Bank conducted two open market operation (OMO) purchase auctions of ₹ 100 billion each on June 21 and July 19, 2018.
13. Export growth picked up in May and June 2018 on a y-o-y basis, aided by engineering goods, petroleum products, drugs and pharmaceuticals, and chemicals. Import growth also accelerated largely due to an increase in crude oil prices. Among non-oil imports, gold imports declined due to lower volume, while imports of machinery, coal, electronic goods, chemicals, and iron and steel increased sharply. Double-digit import growth in May and June pushed up the trade deficit. On the financing side, net foreign direct investment (FDI) flows improved significantly in the first two months of 2018-19. With the tightening of liquidity conditions in AEs, growing geopolitical concerns and with the escalation of protectionist sentiment, net foreign portfolio investment (FPI) outflows from the domestic capital market have continued, albeit at an increasingly slower rate. India’s foreign exchange reserves were at US$ 404.2 billion on July 27, 2018.
Outlook
14. In the second bi-monthly resolution of 2018-19, CPI inflation for 2018-19 was projected at 4.8-4.9 per cent in H1 and 4.7 per cent in H2, including the HRA impact for central government employees, with risks tilted to the upside. Excluding the impact of HRA revisions, CPI inflation was projected at 4.6 per cent in H1 and 4.7 per cent in H2. Actual inflation outcomes have been slightly below the projected trajectory as the seasonal summer surge in vegetable prices has remained somewhat muted in comparison with its past behaviour and fruits prices have declined.
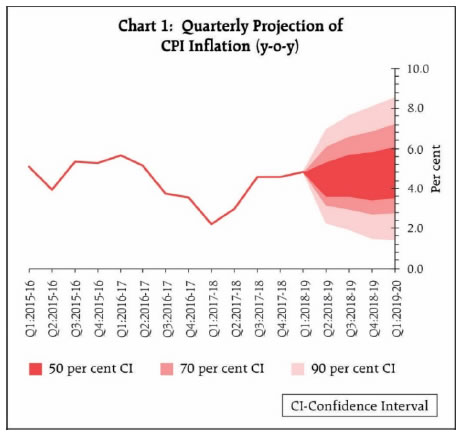
15. The inflation outlook is likely to be shaped by several factors. First, the central government has decided to fix the minimum support prices (MSPs) of at least 150 per cent of the cost of production for all kharif crops for the sowing season of 2018-19. This increase in MSPs for kharif crops, which is much larger than the average increase seen in the past few years, will have a direct impact on food inflation and second round effects on headline inflation. A part of the increase in MSPs based on historical trends was already included in the June baseline projections. As such, only the incremental increase in MSPs over the average increase in the past will impact inflation projections. However, there is a considerable uncertainty and the exact impact would depend on the nature and scale of the government’s procurement operations. Second, the overall performance of the monsoon so far augurs well for food inflation in the medium-term. Third, crude oil prices have moderated slightly, but remain at elevated levels. Fourth, the central government has reduced Goods and Services Tax (GST) rates on several goods and services. This will have some direct moderating impact on inflation, provided there is a pass-through of reduced GST rates to retail consumers. Fifth, inflation in items excluding food and fuel has been broad-based and has risen significantly in recent months, reflecting greater pass-through of rising input costs and improving demand conditions. Finally, financial markets continue to be volatile. Based on an assessment of the above-mentioned factors, inflation is projected at 4.6 per cent in Q2, 4.8 per cent in H2 of 2018-19 and 5.0 per cent in Q1:2019-20, with risks evenly balanced (Chart 1). Excluding the HRA impact, CPI inflation is projected at 4.4 per cent in Q2, 4.7-4.8 per cent in H2 and 5.0 per cent in Q1:2019-20.
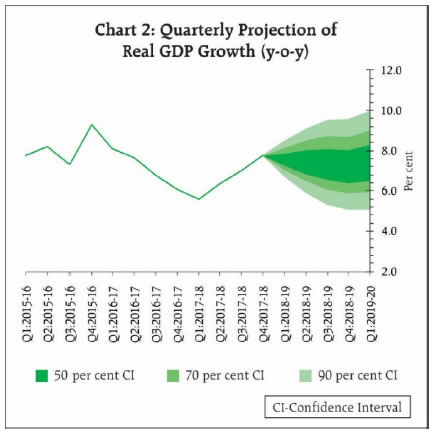
16. Turning to the growth outlook, various indicators suggest that economic activity has continued to be strong. The progress of the monsoon so far and a sharper than the usual increase in MSPs of kharif crops are expected to boost rural demand by raising farmers’ income. Robust corporate earnings, especially of fast moving consumer goods (FMCG) companies, also reflect buoyant rural demand. Investment activity remains firm even as there has been some tightening of financing conditions in the recent period. Increased FDI flows in recent months and continued buoyant domestic capital market conditions bode well for investment activity. The Reserve Bank’s IOS indicates that activity in the manufacturing sector is expected to remain robust in Q2, though there may be some moderation in pace. Rising trade tensions may, however, have an adverse impact on India’s exports. Based on an overall assessment, GDP growth projection for 2018-19 is retained, as in the June statement, at 7.4 per cent, ranging 7.5-7.6 per cent in H1 and 7.3-7.4 per cent in H2, with risks evenly balanced; GDP growth for Q1:2019-20 is projected at 7.5 per cent (Chart 2).
17. Even as inflation projections for Q2 have been revised marginally downwards vis-à-vis the June statement, projections for Q3 onwards remain broadly unchanged. Several risks persist. First, crude oil prices continue to be volatile and vulnerable to both upside and downside risks. In particular, while geopolitical tensions and supply disruptions remain an upside risk to oil prices, the fall in global demand due to further intensification of protectionist trade policies could pull down oil prices. Second, volatility in global financial markets continues to impart uncertainty to the inflation outlook. Third, households’ inflation expectations, as measured by the Reserve Bank’s survey, have risen significantly in the last two rounds, which could influence actual inflation outcomes in the months to come. Fourth, manufacturing firms polled in the Reserve Bank’s industrial outlook survey have reported hardening of input price pressures in Q2 of 2018-19. However, if the recent softening of global commodity prices persists, it could mitigate some of the upward pressure on input costs. Fifth, though the monsoon has been normal temporally so far, its regional distribution needs to be carefully monitored in the context of key CPI components such as paddy. Sixth, in case there is fiscal slippage at the centre and/or state levels, it could have adverse implications for market volatility, crowd out private investment and impact the outlook for inflation. Seventh, uncertainty around the full impact of MSP on inflation will only resolve in the next several months once the price support schemes are implemented. Finally, the staggered impact of HRA revision by state governments may push headline inflation up. While the statistical impact of HRA revisions will be looked through, there is need to watch out for any second-round impact on inflation.
18. Against the above backdrop, the MPC decided to increase the policy repo rate by 25 basis points. The MPC reiterates its commitment to achieving the medium-term target for headline inflation of 4 per cent on a durable basis.
19. The MPC notes that domestic economic activity has continued to sustain momentum and the output gap has virtually closed. However, uncertainty around domestic inflation needs to be carefully monitored in the coming months. In addition, recent global developments raise some concerns. Rising trade protectionism poses a grave risk to near-term and long-term global growth prospects by adversely impacting investment, disrupting global supply chains and hampering productivity. Geopolitical tensions and elevated oil prices continue to be the other sources of risk to global growth.
20. Dr. Chetan Ghate, Dr. Pami Dua, Dr. Michael Debabrata Patra, Dr. Viral V. Acharya and Dr. Urjit R. Patel voted in favour of the decision; Dr. Ravindra H. Dholakia voted against the decision. The minutes of the MPC’s meeting will be published by August 16, 2018.
21. The next meeting of the MPC is scheduled from October 3 to 5, 2018."
0 comments:
Post a Comment